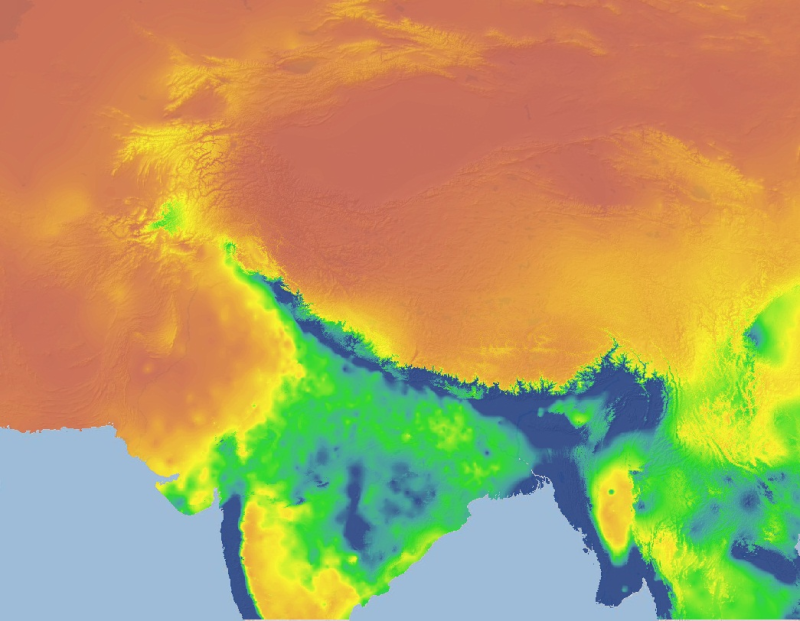
The HKH Region Climate data were derived from WorldClim(http://www.worldclim.org/), This map layer shows precipitation of wettest month for the period of 1950-2000.
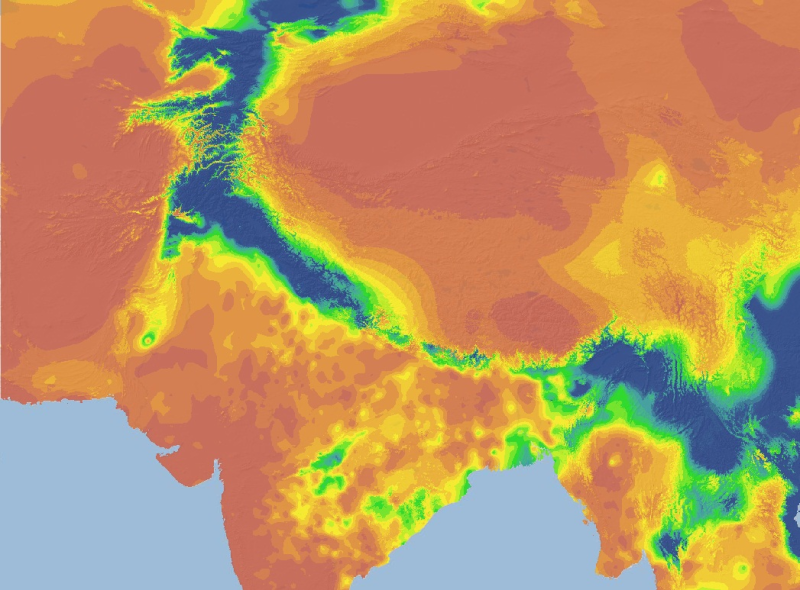
The HKH Region Climate data were derived from WorldClim(http://www.worldclim.org/), This map layer shows warmest quarter precipitation, for the period of 1950-2000.
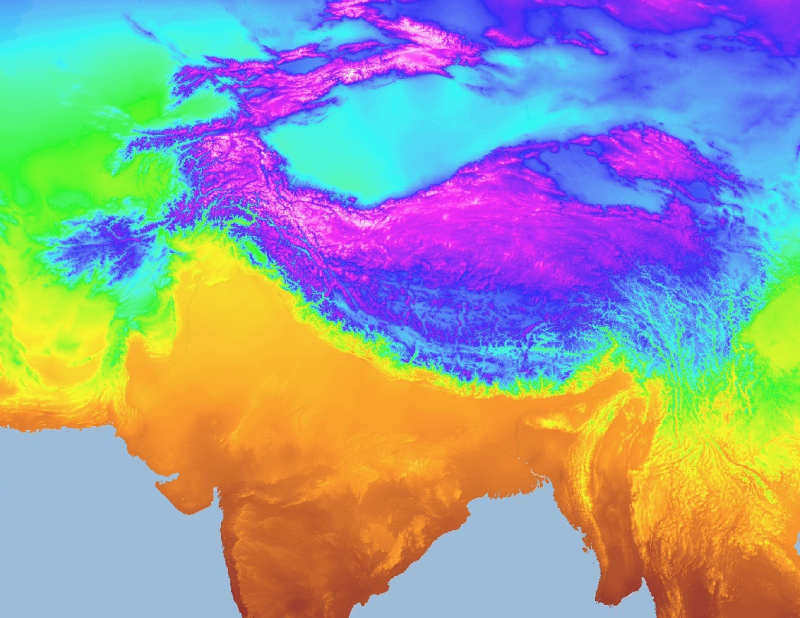
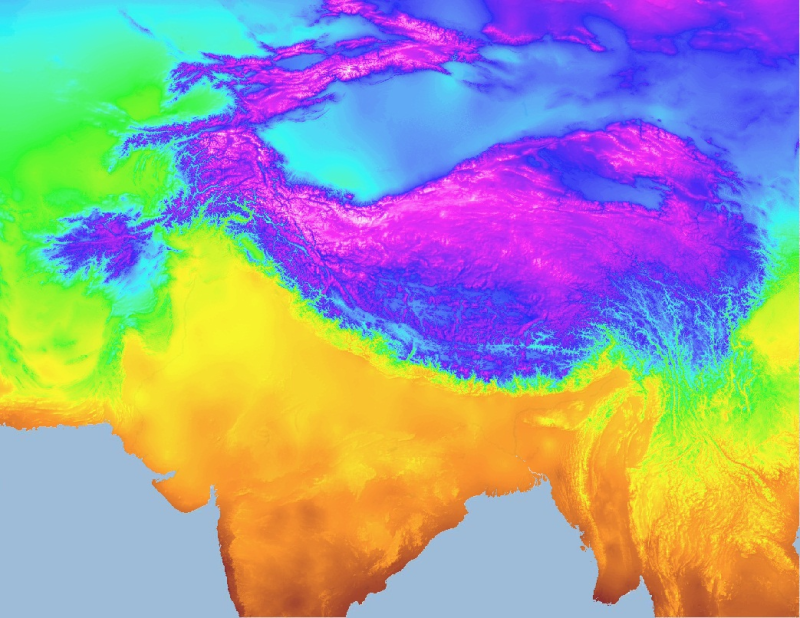
The HKH Region Climate data were derived from WorldClim(http://www.worldclim.org/), This map layer shows mean temperature of coldest quarter for the period of 1950-2000.
The HKH Region Climate data were derived from WorldClim(http://www.worldclim.org/), This map layer shows seasonality precipitation, for the period of 1950-2000.
The HKH Region Climate data were derived from WorldClim(http://www.worldclim.org/), This map layer shows mean temperature of driest quarter for the period of 1950-2000.
The HKH Region Climate data were derived from WorldClim(http://www.worldclim.org/), This map layer shows precipitation of driest month for the period of 1950-2000.
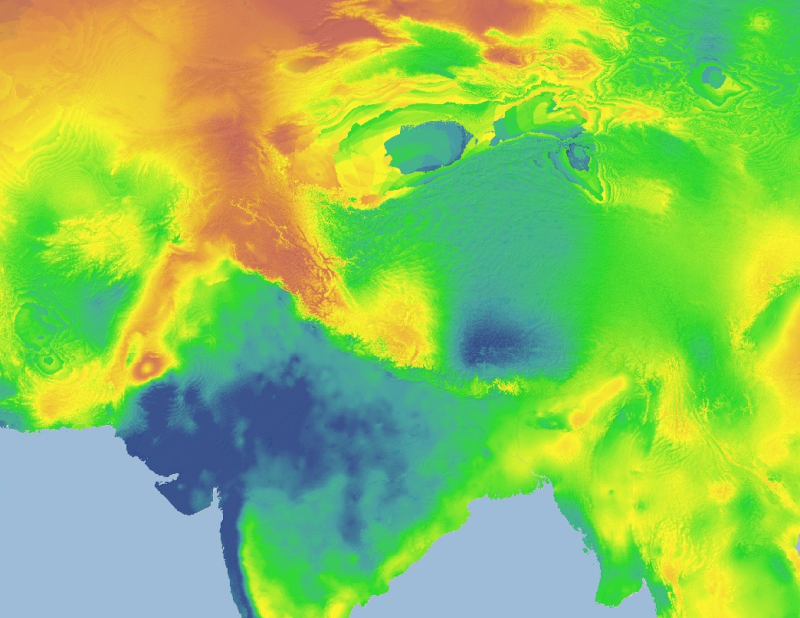
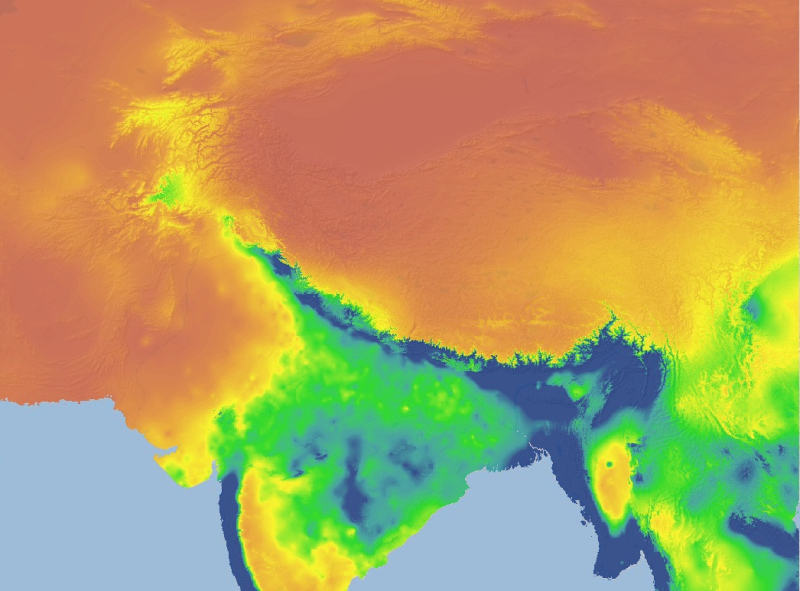
The HKH Region Climate data were derived from WorldClim(http://www.worldclim.org/), This map layer shows annual mean temperature for the period of 1950-2000.
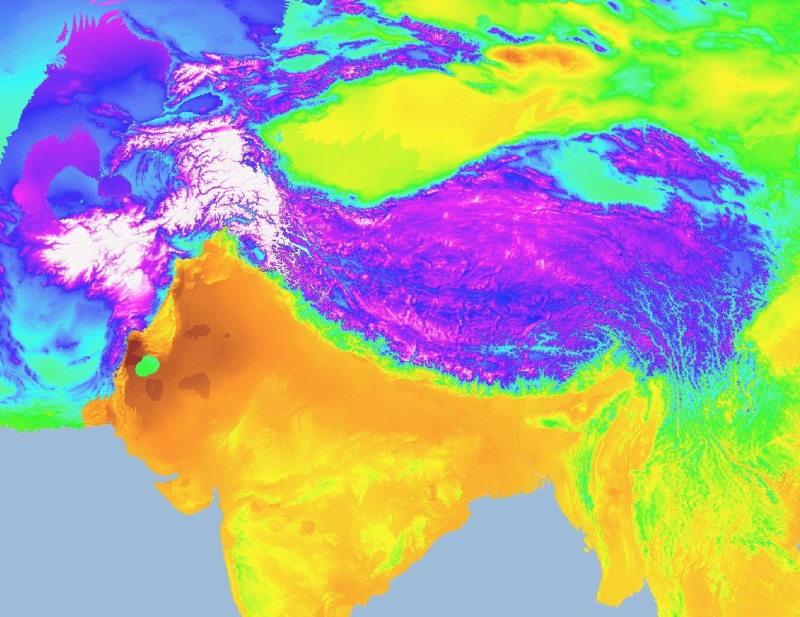
The HKH Region Climate data were derived from WorldClim(http://www.worldclim.org/), This map layer shows minimum temperature of coolest month for the period of 1950-2000.
The HKH Region Climate data were derived from WorldClim(http://www.worldclim.org/), This map layer shows precipitation of wettest quarter for the period of 1950-2000.
The HKH Region Climate data were derived from WorldClim(http://www.worldclim.org/), This map layer shows mean temperature of wettest quarter for the period of 1950-2000.