Digital point dataset of Residential areas of Central Karakoram National Park (CKNP) area, Pakistan. This dataset is created using topographic sheet maps at scale of 20000.
Digital point dataset of Mountain Passes of Central Karakoram National Park (CKNP) area, Pakistan. This dataset is created from topographic sheet maps at scale of 20000. Created dataset is verified t..
Digital point dataset of Bridge locations of Central Karakoram National Park (CKNP) area, Pakistan. This dataset is created using topographic sheet maps at scale of 20000.
Digital point dataset of Tehsil Headquarter of Central Karakoram National Park (CKNP) area, Pakistan. This dataset is created using topographic sheet maps at scale of 20000.
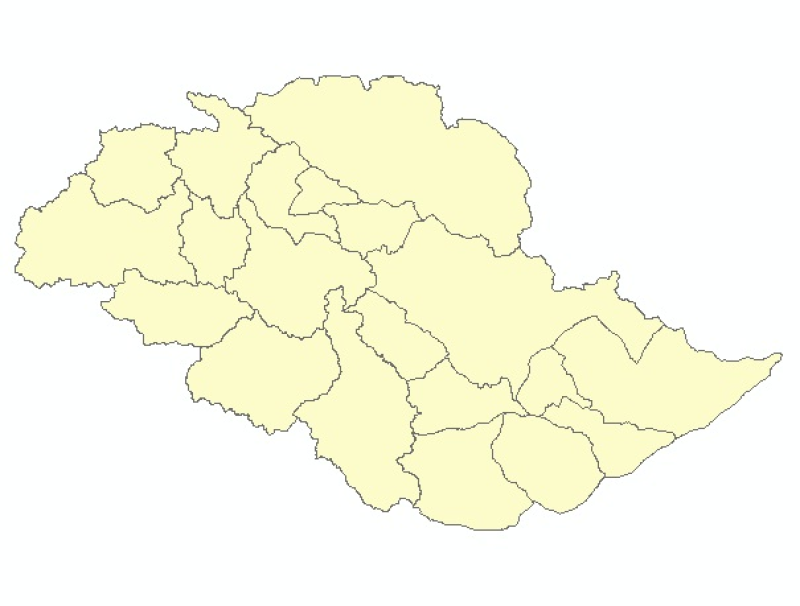
Digital polygon dataset of Tehsil boundaries of Central Karakoram National Park (CKNP) area, Pakistan. This dataset is created using topographic sheet maps at scale of 20000.
Digital polygon dataset of Park Boundary of Central Karakoram National Park (CKNP) area, Pakistan. This dataset is created using topographic sheet maps at scale of 20000.
Digital point dataset of District Headquarter of Central Karakoram National Park (CKNP) area, Pakistan. This dataset is created using topographic sheet maps at scale of 20000.
Digital polygon dataset of District boundary of Central Karakoram National Park(CKNP) area, Pakistan. This dataset is created using topographic sheet maps at scale of 20000.
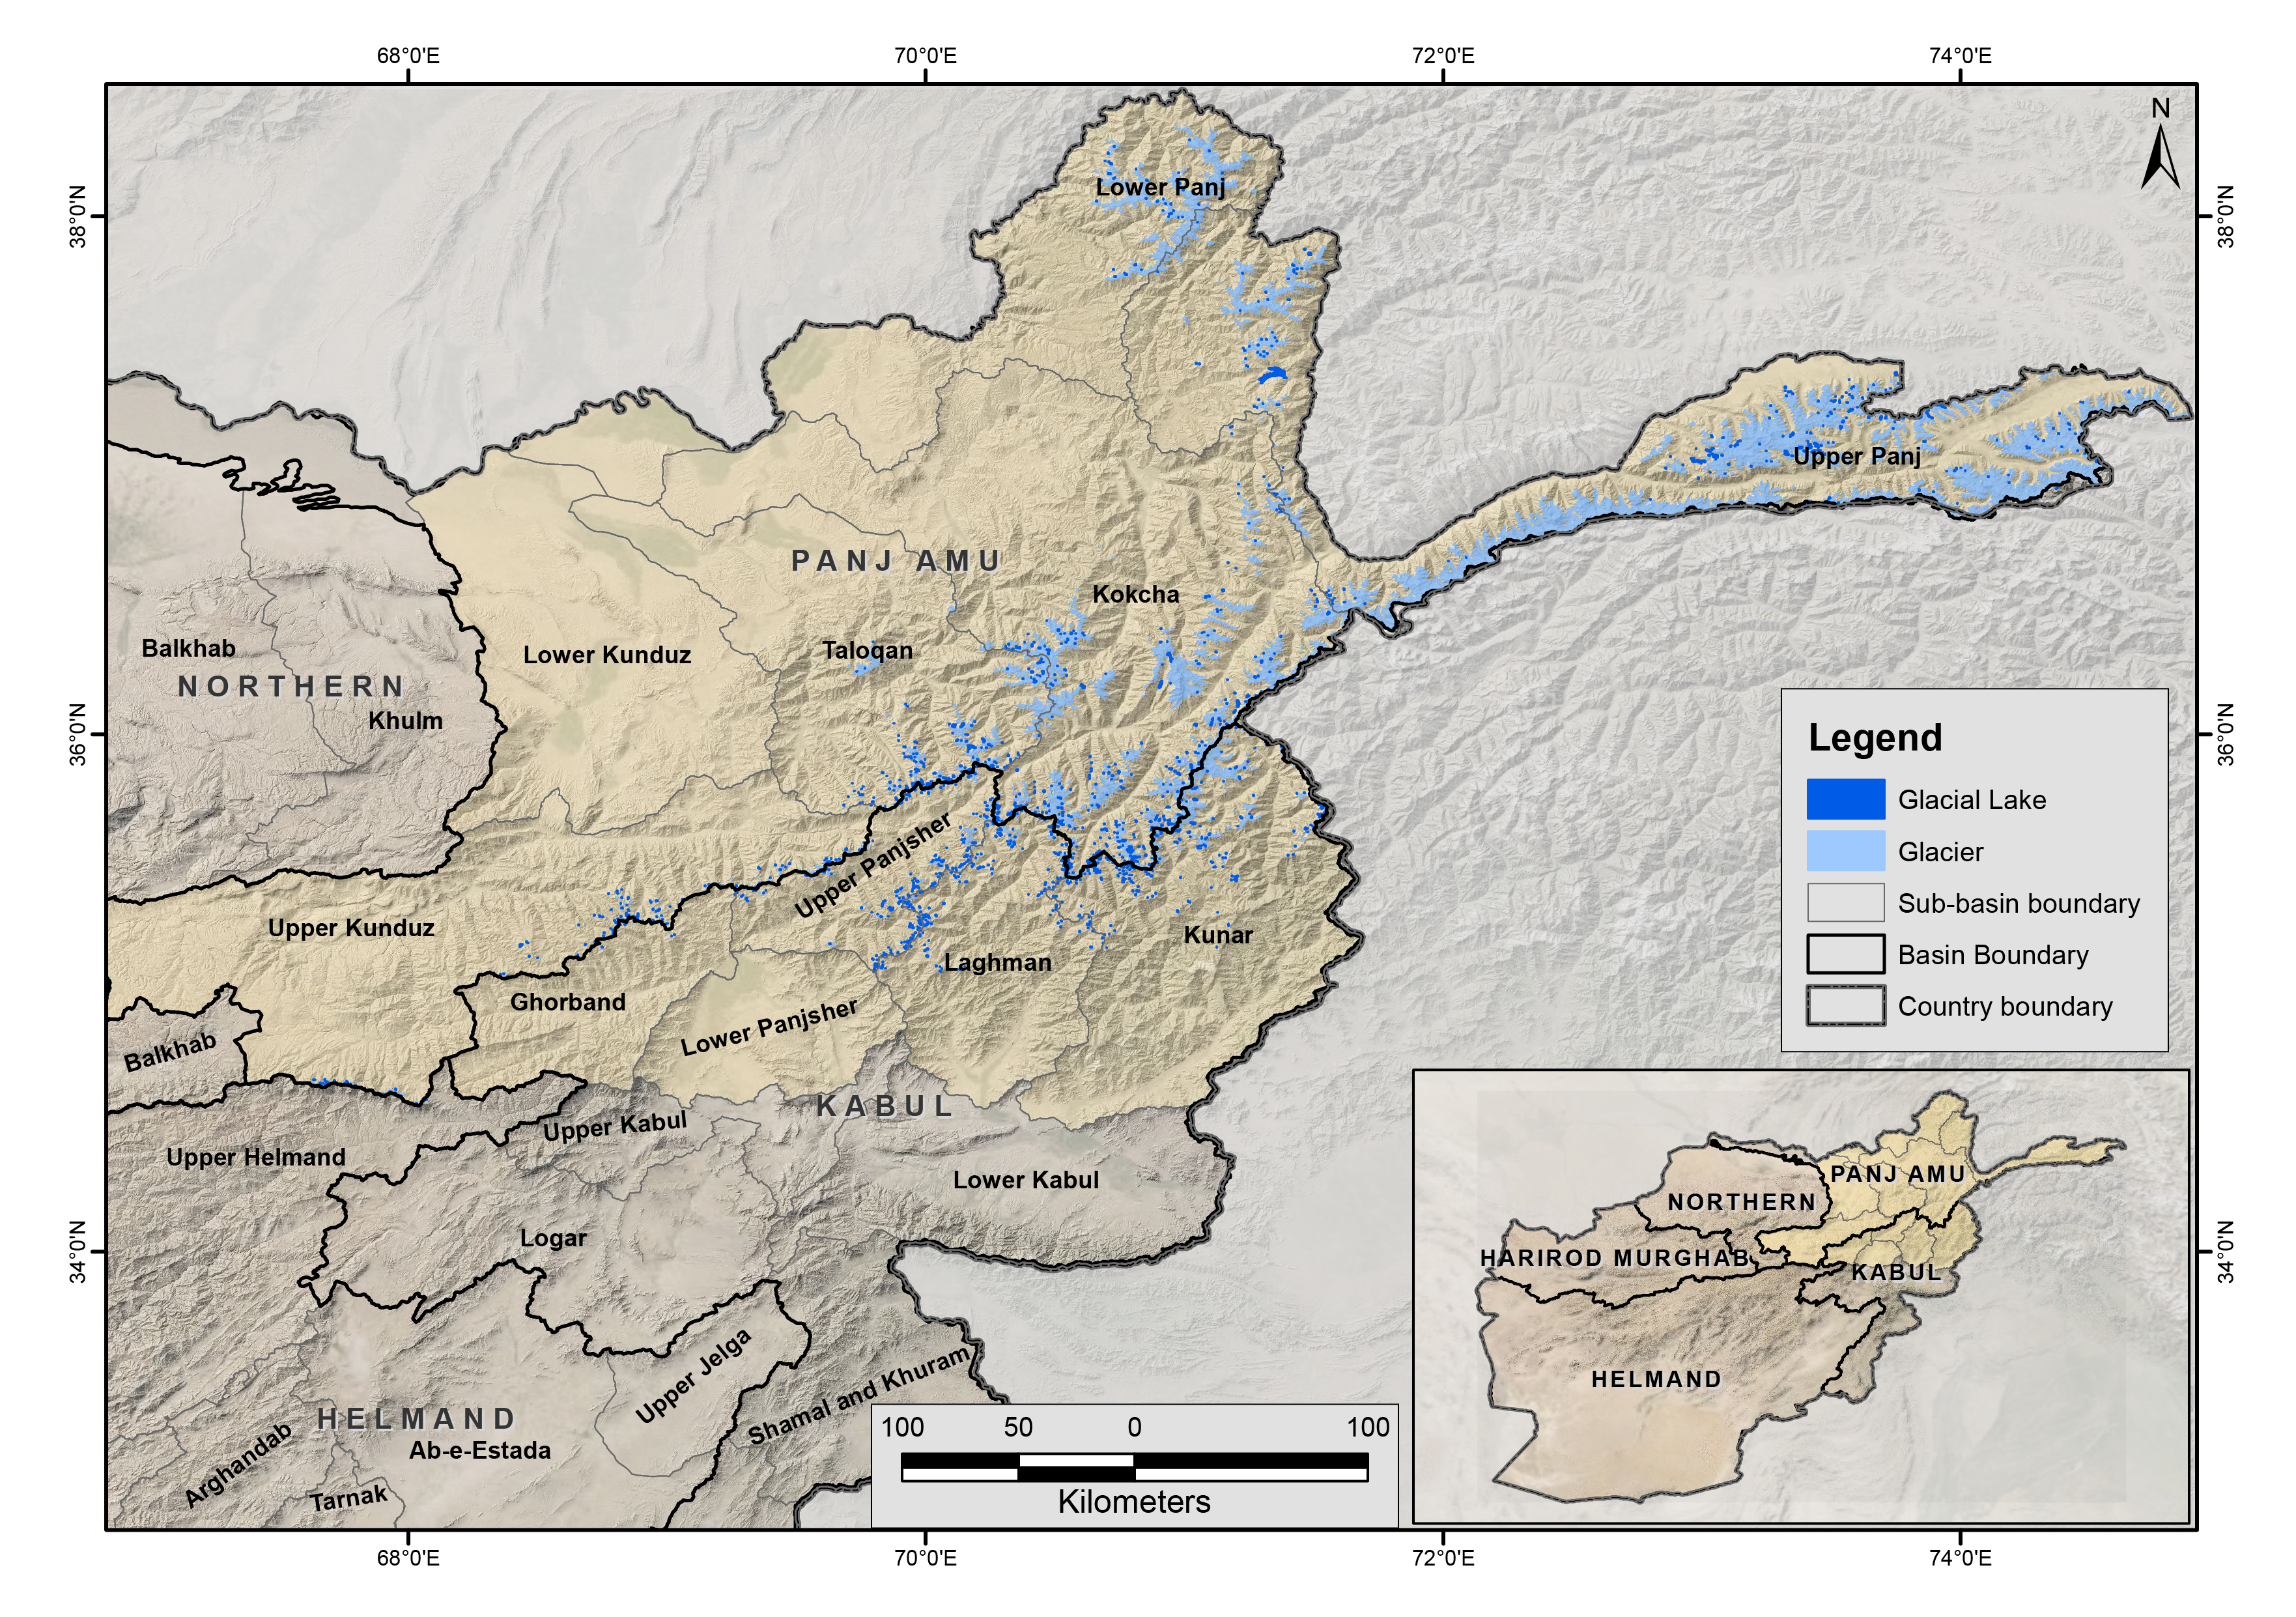
The glacial lakes of Afghanistan were mapped using Landsat image that were selected based in a one-year buffer surrounding a representative year. For instance, the Landsat images from 2014 to 2016 we..