 Metadata Catalogue
climatologyMeteorologyAtmosphere
Type of resources
Available actions
Topics
Keywords
Contact for the resource
Provided by
Years
Representation types
Update frequencies
status
Scale
Resolution
-
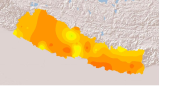
Daily mean sunshine duration of January 2001 of Nepal. This dataset is created using actual daily sunshine averages using Win-surfer and GIS-arc/info software packages. The mean values were derived from daily sunshine readings.
-
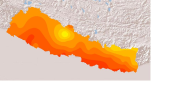
Daily mean sunshine duration of March 2001 of Nepal. This dataset is created using actual daily sunshine averages using Win-surfer and GIS-arc/info software packages. The mean values were derived from daily sunshine readings.
-
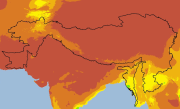
Digital grid dataset of monthly maximum temperature (May) for the period of 1950-2000 of Hindu Kush Himalayan (HKH) Region. The dataset is derived from WorldClim (http://www.worldclim.org/), and major climate databases compiled by the Global Historical Climatology Network (GHCN), the FAO, the WMO, the International Center for Tropical Agriculture (CIAT), R-HYdronet. Monthly maximum temperature data set consists of 12 raster files, one for each month, showing mean values derived from monthly temperature readings. The data layers were generated through interpolation of average monthly climate data from weather stations on a 30 arc-second resolution grid.
-
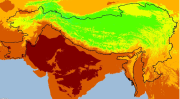
Digital grid dataset of monthly precipitation (November) for the period of 1950-2000 of Hindu Kush Himalayan (HKH) Region. The dataset is derived from WorldClim (http://www.worldclim.org/), and major climate databases compiled by the Global Historical Climatology Network(GHCN),the FAO, the WMO, the International Center for Tropical Agriculture (CIAT), R-HYdronet. Monthly Precipitation data set consists of 12 raster files, one for each month, showing mean values derived from monthly precipitation readings. The data layers were generated through interpolation of average monthly climate data from weather stations on a 30 arc-second resolution grid.
-

Bias-corrected reference climate dataset for daily mean air temperature (Tavg), daily maximum air temperature (Tmax), daily minimum air temperature (Tmin) and daily precipitation (P). This dataset has a daily temporal resolution spanning 30 years from 1 January 1981 to 31 December 2010 and a spatial resolution of 10x10 km.
-
This Meteorological station shows the measurement of Temperature, Relative Humidity, Wind Direction, Wind Speed, Pressure and Rainfall at Humla, Nepal.
-
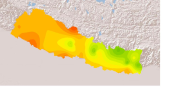
Daily mean sunshine duration of June 2001 of Nepal. This dataset is created using actual daily sunshine averages using Win-surfer and GIS-arc/info software packages. The mean values were derived from daily sunshine readings.
-
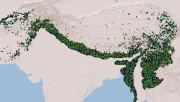
Compiled MODIS Active fire dataset of HKH region derived from FIRMS (Fire Information for Resource Management System). The data shows the locations of fire incidents within HKH region on various dates in the period between 2000 to 2010 along with the confidence level information of such incidents.
-
Average data for Whole Indus from year 1961 to 1970 for the month of May in ASCII format. It is an Aphrodite data with 0.25 resolution in x and y direction. The APHRODITE project develops state-of-the-art daily precipitation datasets with high-resolution grids. The datasets are created primarily with data obtained from a rain-gauge-observation network.
-
Average data for Whole Indus from year 1991 to 2000 for the month of July in ASCII format. It is an Aphrodite data with 0.25 resolution in x and y direction. The APHRODITE project develops state-of-the-art daily precipitation datasets with high-resolution grids. The datasets are created primarily with data obtained from a rain-gauge-observation network.