 Metadata Catalogue
Precipitation
Type of resources
Available actions
Topics
Keywords
Contact for the resource
Provided by
Representation types
Update frequencies
status
Scale
Resolution
-

The HKH Region Climate data were derived from WorldClim(http://www.worldclim.org/), This map layer shows precipitation of driest month for the period of 1950-2000.
-

The HKH Region Climate data were derived from WorldClim(http://www.worldclim.org/), This map layer shows precipitation of driest quarter for the period of 1950-2000.
-
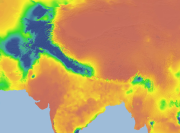
The HKH Region Climate data were derived from WorldClim(http://www.worldclim.org/), This map layer shows precipitation of coolest quarter for the period of 1950-2000.
-
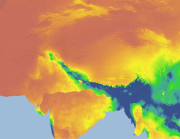
The HKH Region Climate data were derived from WorldClim(http://www.worldclim.org/), This map layer shows warmest quarter precipitation, for the period of 1950-2000.
-
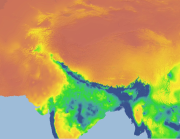
The HKH Region Climate data were derived from WorldClim(http://www.worldclim.org/), This map layer shows precipitation of wettest month for the period of 1950-2000.
-
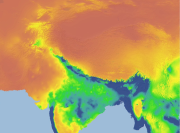
The HKH Region Climate data were derived from WorldClim(http://www.worldclim.org/), This map layer shows precipitation of wettest quarter for the period of 1950-2000.
-
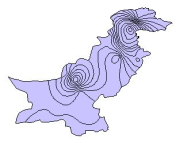
Digital polygon dataset of Average annual precipitation for Pakistan. The dataset is derived from Digital Chart of the world, DCW. The data layer is generated through interpolation of average monthly precipitation data from weather stations on a 30 arc-second resolution grid.
-

The HKH Region Climate data were derived from WorldClim(http://www.worldclim.org/), This map layer shows seasonality precipitation, for the period of 1950-2000.
-
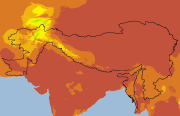
Digital grid dataset of monthly precipitation (December) for the period of 1950-2000 of Hindu Kush Himalayan (HKH) Region. The dataset is derived from WorldClim (http://www.worldclim.org/), and major climate databases compiled by the Global Historical Climatology Network(GHCN),the FAO, the WMO, the International Center for Tropical Agriculture (CIAT), R-HYdronet. Monthly Precipitation data set consists of 12 raster files, one for each month, showing mean values derived from monthly precipitation readings. The data layers were generated through interpolation of average monthly climate data from weather stations on a 30 arc-second resolution grid.
-
Annual Mean Precipitation data for Caurikhark station, Koshi Basin, Nepal. This dataset is based on average daily precipitation reading which is accumulated for month and Accumulated monthly totals for the year.