 Metadata Catalogue
Indus
Type of resources
Available actions
Topics
Keywords
Contact for the resource
Provided by
Years
Representation types
Update frequencies
status
Scale
Resolution
-

The glacial lakes of Afghanistan were mapped using Landsat image that were selected based in a one-year buffer surrounding a representative year. For instance, the Landsat images from 1989 to 1991 were used to represent 1990 depending on the quality of images (least snow cover and cloud cover). The glacial lakes were extracted semi-automatically through an object-based image classification (OBIC) method and were then subjected to manual editing for quality control. The attributes of the data were extracted from the SRTM DEM. This dataset was produced in collaboration between the National Water Affairs Regulation Authority (NWARA) of the Government of Afghanistan and ICIMOD as part of the SERVIR-HKH Initiative.
-

The glacial lakes of Afghanistan were mapped using Landsat image that were selected based in a one-year buffer surrounding a representative year. For instance, the Landsat images from 2014 to 2016 were used to represent 2015 depending on the quality of images (least snow cover and cloud cover). The glacial lakes were extracted semi-automatically through an object-based image classification (OBIC) method and were then subjected to manual editing for quality control. The attributes of the data were extracted from the SRTM DEM. This dataset was produced in collaboration between the National Water Affairs Regulation Authority (NWARA) of the Government of Afghanistan and ICIMOD as part of the SERVIR-HKH Initiative.
-
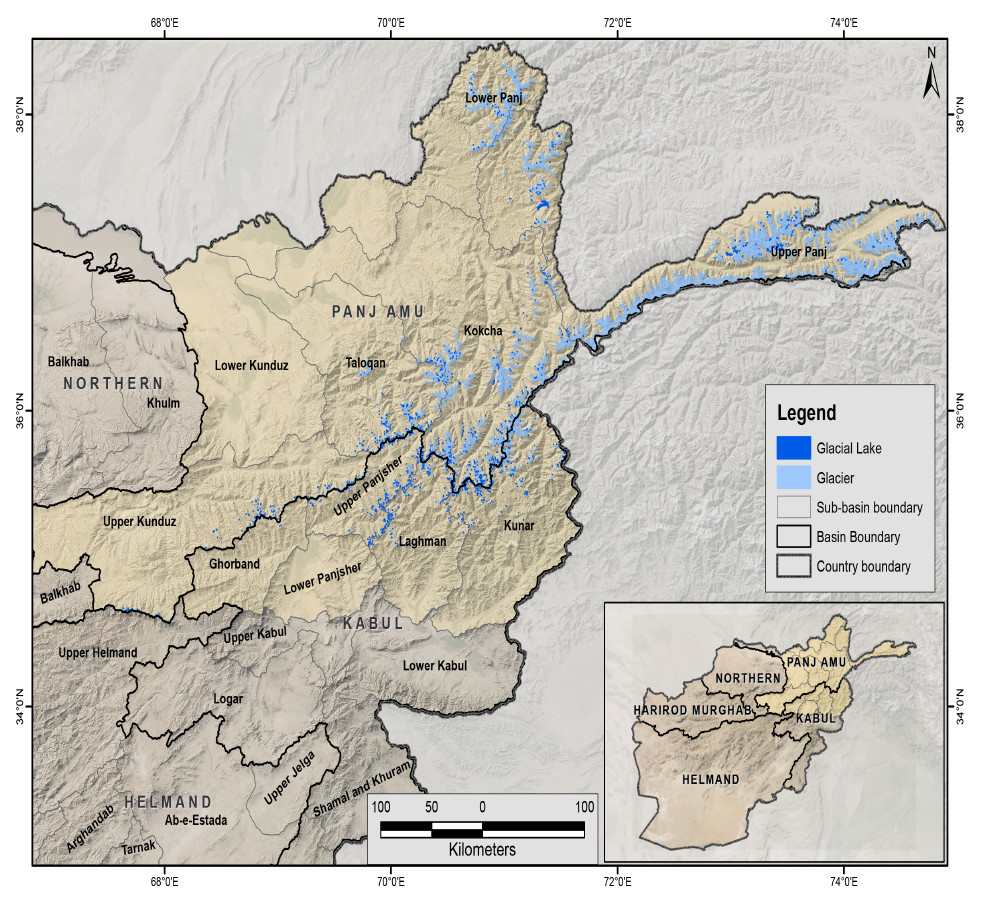
The glacial lakes of Afghanistan were mapped using Landsat image that were selected based in a one-year buffer surrounding a representative year. For instance, the Landsat images from 1999 to 2001 were used to represent 2000 depending on the quality of images (least snow cover and cloud cover). The glacial lakes were extracted semi-automatically through an object-based image classification (OBIC) method and were then subjected to manual editing for quality control. The attributes of the data were extracted from the SRTM DEM. This dataset was produced in collaboration between the National Water Affairs Regulation Authority (NWARA) of the Government of Afghanistan and ICIMOD as part of the SERVIR-HKH Initiative.
-
The glacial lakes of Afghanistan were mapped using Landsat image that were selected based in a one-year buffer surrounding a representative year. For instance, the Landsat images from 2009 to 2011 were used to represent 2010 depending on the quality of images (least snow cover and cloud cover). The glacial lakes were extracted semi-automatically through an object-based image classification (OBIC) method and were then subjected to manual editing for quality control. The attributes of the data were extracted from the SRTM DEM. This dataset was produced in collaboration between the National Water Affairs Regulation Authority (NWARA) of the Government of Afghanistan and ICIMOD as part of the SERVIR-HKH Initiative.
-
This layer gives information about the major rivers of Kailash Sacred Landscape.
-

NorESM climate scenario data of 4.5 and 8.5 W/m2 of daily rainfall Tmin and Tmax.
-

Glacier data of Afghanistan were prepared on the basis of Landsat imageries from 2015. The glacier outlines were derived semi-automatically using object-based image classification (OBIC) separately for clean-ice and debris-covered glaciers and further manual editing for quality assurance. The attributes of glacier data were derived from SRTM DEM. This dataset was jointly prepared by the Ministry of Energy and Water (MEW), Government of Afghanistan, and ICIMOD under the SERVIR-HKH Initiative.
-

Glacier data of Afghanistan were prepared on the basis of Landsat imageries from 1990. The glacier outlines were derived semi-automatically using object-based image classification (OBIC) separately for clean-ice and debris-covered glaciers and further manual editing for quality assurance. The attributes of glacier data were derived from SRTM DEM. This dataset was jointly prepared by the Ministry of Energy and Water (MEW), Government of Afghanistan, and ICIMOD under the SERVIR-HKH Initiative.
-

Glacier data of Afghanistan were prepared on the basis of Landsat imageries from 2000. The glacier outlines were derived semi-automatically using object-based image classification (OBIC) separately for clean-ice and debris-covered glaciers and further manual editing for quality assurance. The attributes of glacier data were derived from SRTM DEM. This dataset was jointly prepared by the Ministry of Energy and Water (MEW), Government of Afghanistan, and ICIMOD under the SERVIR-HKH Initiative.
-

Daily NEX-GDDP data (Tmin, Tmax and Precipitation) for different scenario (reference period, future projection), RCP 4.5 and RCP 8.5. These following models are included in data; ACCESS1-0,bcc-csm1-1,BNU-ESM,CanESM2,CCSM4,CESM1-BGC,CNRM-CM5,CSIRO-Mk3-6-0,GFDL-CM3,GFDL-ESM2G,GFDL-ESM2M,inmcm4,IPSL-CM5A-LR,IPSL-CM5A-MR,MIROC5,MIROC-ESM,MIROC-ESM-CHEM,MPI-ESM-LR,MPI-ESM-MR,MRI-CGCM3,NorESM1-M are used for simulating the global climate change between 1950- 2100.