 Metadata Catalogue
HKH
Type of resources
Available actions
Topics
Keywords
Contact for the resource
Provided by
Formats
Representation types
Update frequencies
status
Scale
Resolution
-

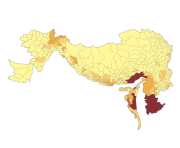
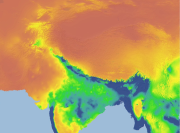
The HKH Region Climate data were derived from WorldClim(http://www.worldclim.org/), This map layer shows precipitation of driest month for the period of 1950-2000.
-
Digital polygon dataset of Major spoken Languages of Hindu Kush Himalayan (HKH) Region. This dataset is basic vector layer derived from ESRI Map & Data in 2001 and language data acquired from CEGG/ICIMOD.
-
The HKH Region Climate data were derived from WorldClim(http://www.worldclim.org/), This map layer shows monthly precipitation, for the period of 1950-2000. The data layers were generated through interpolation of average monthly climate data from weather stations on a 30 arc-second resolution grid. Major climate databases compiled by the Global Historical Climatology Network(GHCN),the FAO, the WMO, the International Center for Tropical Agriculture (CIAT), R-HYdronet. Monthly Precipitation data set consists of 12 raster files, one for each month, showing mean values derived from monthly precipitation readings.
-
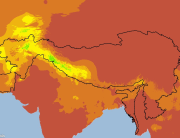
The HKH Region Climate data were derived from WorldClim(http://www.worldclim.org/), This map layer shows annual mean temperature for the period of 1950-2000.
-
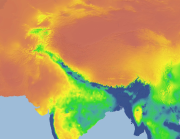
The HKH Region Climate data were derived from WorldClim(http://www.worldclim.org/), This map layer shows annual precipitation, for the period of 1950-2000.
-
The HKH Region Climate data were derived from WorldClim(http://www.worldclim.org/), This map layer shows precipitation of wettest quarter for the period of 1950-2000.
-
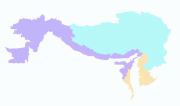
Digital polygon dataset of Geographic regions of Hindu Kush Himalayan (HKH) Region. This dataset is basic vector layer derived from ESRI Map & Data in 2001.
-

The HKH Region Climate data were derived from WorldClim(http://www.worldclim.org/), This map layer shows mean temperature of wettest quarter for the period of 1950-2000.
-

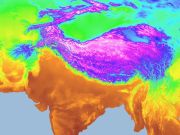
The HKH Region Climate data were derived from WorldClim(http://www.worldclim.org/), This map layer shows mean temperature of coldest quarter for the period of 1950-2000.
-

The HKH Region Climate data were derived from WorldClim(http://www.worldclim.org/), This map layer shows mean temperature of driest quarter for the period of 1950-2000.