 Metadata Catalogue
Climate
Type of resources
Available actions
Topics
Keywords
Contact for the resource
Provided by
Representation types
Update frequencies
status
Scale
Resolution
-

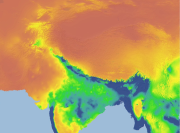
The HKH Region Climate data were derived from WorldClim(http://www.worldclim.org/), This map layer shows precipitation of driest month for the period of 1950-2000.
-
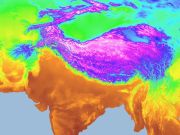
The HKH Region Climate data were derived from WorldClim(http://www.worldclim.org/), This map layer shows annual mean temperature for the period of 1950-2000.
-
The HKH Region Climate data were derived from WorldClim(http://www.worldclim.org/), This map layer shows precipitation of wettest quarter for the period of 1950-2000.
-

The HKH Region Climate data were derived from WorldClim(http://www.worldclim.org/), This map layer shows mean temperature of wettest quarter for the period of 1950-2000.
-

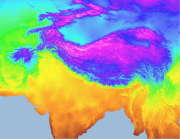
The HKH Region Climate data were derived from WorldClim(http://www.worldclim.org/), This map layer shows mean temperature of coldest quarter for the period of 1950-2000.
-

The HKH Region Climate data were derived from WorldClim(http://www.worldclim.org/), This map layer shows mean temperature of driest quarter for the period of 1950-2000.
-

The HKH Region Climate data were derived from WorldClim(http://www.worldclim.org/), This map layer shows annual temperature range for the period of 1950-2000.
-

The HKH Region Climate data were derived from WorldClim(http://www.worldclim.org/), This map layer shows maximum temperature of warmest month for the period of 1950-2000.
-

The HKH Region Climate data were derived from WorldClim(http://www.worldclim.org/), This map layer shows precipitation of driest quarter for the period of 1950-2000.
-
The HKH Region Climate data were derived from WorldClim(http://www.worldclim.org/), This map layer shows minimum temperature of coolest month for the period of 1950-2000.