Agriculture
Type of resources
Available actions
Topics
Keywords
Contact for the resource
Provided by
Years
Representation types
Update frequencies
status
Scale
Resolution
-

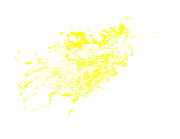
Digital polygon dataset of Cultivated land of Afghanistan. This dataset is created using 1:1,000,000 scale map of Afghanistan and derived from Afghanistan Information Management Systems (AIMS), Afghanistan.
-
The layer demonstrate both irrigated and rain-fed wheat area cultivation in the country.
-
Digital table data of Livestock population of Koshi Basin. The dataset is compiled using data sources from Statistical information on Nepalese agriculture, MoAD(2012); Economic Survey (2011/2012), Government of Bihar, India. Koshi basin consist more than 23 million big and medium sized livestock (cow, buffalo, sheep, goat and pig).
-

Digital dataset of Agriculture Cover of Central Karakoram National Park(CKNP) area, Pakistan. This dataset is extracted from land cover dataset of 2010 created from 30m resolution LandSat imagery of 2010.
-

The dataset present the crop sown area for rice crop during 2010 - 2015.
-
Digital table data of Livestock and livestock products of Koshi Basin. This dataset is compiled using data sources from Statistical information on Nepalese agriculture, MoAD(2012); Economic Survey (2011/2012), Government of Bihar, India.
-

Wheat is cultivated on more than 2.7 million hectares in Afghanistan annually, yet the country is dependent on imports to meet domestic demand. The timely estimation of domestic wheat production is highly critical to address any potential food security issues and has been identified as a priority by the Ministry of Agriculture Irrigation and Livestock (MAIL). In this study, we developed a system for in-season mapping of wheat crop area based on both optical (Sentinel-2) and synthetic aperture radar (SAR, Sentinel-1) data to support estimation of wheat cultivated area for management and food security planning. Utilizing a 2010 Food and Agriculture Organization (FAO) cropland mask, wheat sown area for 2017 was mapped integrating decision trees and machine learning algorithms in the Google Earth Engine cloud platform. Information from provincial crop calendars in addition to training and validation data from field-based surveys, and high-resolution Digitalglobe and Airbus Pleiades images were used for classification and validation. The total irrigated and rainfed wheat area were estimated as 912,525 and 562,611 ha, respectively for 2017. Province-wise accuracy assessments show the maximum accuracy of irrigated (IR) and rainfed (RF) wheat across provinces was 98.76 and 99%, respectively, whereas the minimum accuracy was found to be 48% (IR) and 73% (RF). The lower accuracy is attributed to the unavailability of reference data, cloud cover in the satellite images and overlap of spectral reflectance of wheat with other crops, especially in the opium poppy growing provinces. While the method is designed to provide estimation at different stages of the growing season, the best accuracy is achieved at the end of harvest using time-series satellite data for the whole season. The approach followed in the study can be used to generate wheat area maps for other years to aid in food security planning and policy decisions. Detail methodology and data quality information are described in the published article (Tiwari et.al 2020, Wheat Area Mapping in Afghanistan Based on Optical and SAR Time-Series Images in Google Earth Engine Cloud Environment, https://doi.org/10.3389/fenvs.2020.00077)
-
The Poverty and Vulnerability Assessment Tool (PVAT) dataset was developed to capture the micro-level perspective of people's experiences with poverty and vulnerability and to monitor poverty and vulnerability trends on the ground. The assessment was based on a standardized questionnaire that has been developed to assess, describe, and analyse the situation of poor and vulnerable people in the Nepal. This will lead to an enhanced understanding of multiple aspects of livelihood assets, structures, and the processes that underpin such assets. It will also help determine levels of access, terms of exchange, and returns from livelihood assets as well as livelihood strategies and their outcomes for the poor. PVAT was conducted twice in 2011 and 2012. Sankhuwashava,Terthum, Saptari, Gorkha, Jajarkot, Kailali, Bajhang and Sindhupalchok in 2011. Taplejung, Bhojpur, Solukhumbu, Sindhuli, Rukum, Dailekh, Mugu and Darchula in 2012.
-
Digital table data of Major Agricultural crop production of Koshi Basin. This dataset consists related to area and production of major agricultural crops such as cereals, vegetables, cash crops, oil-seed crops. The dataset is compiled using data sources from Statistical information on Nepalese agriculture, MoAD(2012); Economic Survey (2011/2012), Government of Bihar, India and IMHE Technical Report (2013).
-
The Poverty and Vulnerability Assessment (PVA) dataset was developed to capture the micro-level perspective of people's experiences with poverty and vulnerability and to monitor poverty and vulnerability trends on the ground. The assessment was based on a standardized questionnaire that has been developed to assess, describe, and analyse the situation of poor and vulnerable people in the HKH region. This will lead to an enhanced understanding of multiple aspects of livelihood assets, structures, and the processes that underpin such assets. It will also help determine levels of access, terms of exchange, and returns from livelihood assets as well as livelihood strategies and their outcomes for the poor.
 Metadata Catalogue